

Consumer Insights
Uncover trends and behaviors shaping consumer choices today
Procurement Insights
Optimize your sourcing strategy with key market data
Industry Stats
Stay ahead with the latest trends and market analysis.
The Asia Pacific process automation market was valued at USD 22.54 Billion in 2024. The industry is expected to grow at a CAGR of 6.20% during the forecast period of 2025-2034 to attain a valuation of USD 41.13 Billion by 2034.
Base Year
Historical Period
Forecast Period
In 2022, Singapore witnessed a 68% increase of robot installations, while Malaysia saw an increase of 42%.
As per industry reports, in 2022, China accounted for over 50% of newly installed industrial robots worldwide.
According to International Federation of Robotics, Asia held the largest share of 73% of newly deployed robots on a global scale in 2022.


Compound Annual Growth Rate
6.2%
Value in USD Billion
2025-2034
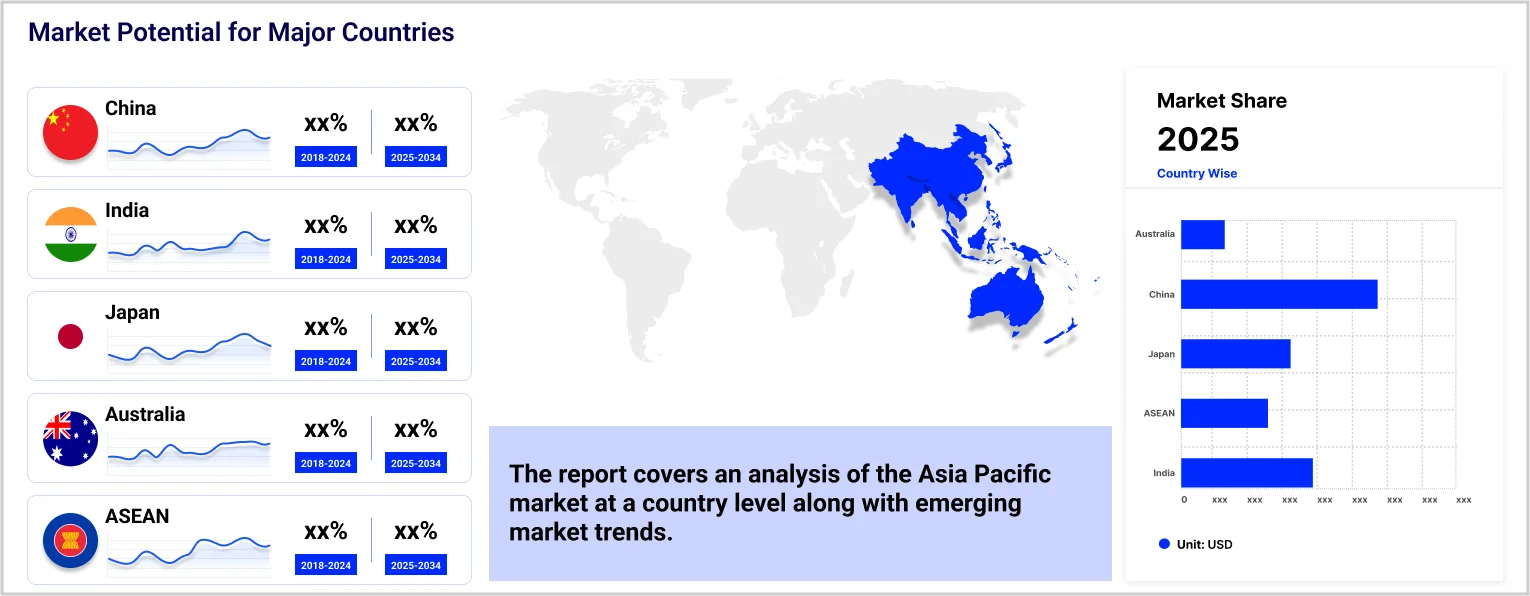
Asia Pacific Process Automation Market Outlook
*this image is indicative*
The Asia Pacific stands as a leading region for manufacturing industry and consumer goods markets. It is estimated that about 60% of the industrial organisations in the region will improve their operations with the adoption of automation technology, thereby gaining a 50% increase in worker efficiency.
Manufacturing companies are increasingly automating their production facilities due to the growing demand for enhanced efficiency, increased productivity, innovation, and the rising costs associated with human labour. Robots are major components of automation for improving productivity and international competitiveness.
Asia Pacific also has a robust automotive industry, which requires manufacturing of vehicles. In 2022, the sales of new vehicles sold in Japan totalled to 4.2 million units while India witnessed at least 4.25 million units. In 2023, the Light Vehicle (LV) production expanded nearly 10% year-on-year (YoY) to 51.8 million units, resulted by the robust production in China, Japan, Korea, and India.
In 2021, South Korea and Japan had the largest density of robots installed per 10,000 workers in the manufacturing sector. Japan is considered the largest manufacturer of industrial robots amounting to 46% of the global production in 2022.


Asia Pacific Process Automation Market Report and Forecast 2025-2034 offers a detailed analysis of the market based on the following segments:
Market Breakup by System Type
Market Breakup by Communication Protocol
Market Breakup by Application
Market Breakup by Country
Additionally, ASEAN countries are also significantly adopting service robots in sectors such as healthcare, logistics and automotive manufacturing. Cobots (collaborative robots) are gaining traction among manufacturers of APAC region due to their ability to work alongside human workers, which offers energy and space-efficient forms of automation and results in significant productivity for business.
Market players are developing AI-powered automation systems allowing for real-time monitoring and optimising the performance of factories


Upto 15% Off
USD
$2499 $2249
$3999 $3599
$4999 $4249
$5999 $5099
*While we strive to always give you current and accurate information, the numbers depicted on the website are indicative and may differ from the actual numbers in the main report. At Expert Market Research, we aim to bring you the latest insights and trends in the market. Using our analyses and forecasts, stakeholders can understand the market dynamics, navigate challenges, and capitalize on opportunities to make data-driven strategic decisions.*
Get in touch with us for a customized solution tailored to your unique requirements and save upto 35%!
The process automation market is estimated to grow at a CAGR of 6.20% between 2025 and 2034.
Wired protocol and wireless protocol are the two types as per the market report.
The major applications are oil and gas, chemicals and mining, consumer goods, pharma and biotech, water and wastewater, automotive, and power, among others.
China, Japan, India, ASEAN, and Australia are the key countries in the market report.
The major system types are supervisory control and data acquisition (SCADA), programmable logic controller (PLC), distributed control system (DCS), machine execution system (MES), valves and actuators, electric motors, human machine interface (HMI), process safety systems, and sensors and transmitters, among others.
The major players in the market are Robert Bosch GmbH, Mitsubishi Electric Corp., Yokogawa Electric Corp, Eaton Corporation Plc, Siemens AG, Schneider Electric SE, ABB Ltd., Delta Electronics, Inc, Fuji Electric Co Ltd, Emerson Electric Co., and Honeywell International Inc., among others.
In 2024, the market attained a value of nearly USD 22.54 Billion.
The market is estimated to witness a healthy growth in the forecast period of 2025-2034 to reach about USD 41.13 Billion by 2034.
Explore our key highlights of the report and gain a concise overview of key findings, trends, and actionable insights that will empower your strategic decisions.
| REPORT FEATURES | DETAILS |
| Base Year | 2024 |
| Historical Period | 2018-2024 |
| Forecast Period | 2025-2034 |
| Scope of the Report |
Historical and Forecast Trends, Industry Drivers and Constraints, Historical and Forecast Market Analysis by Segment:
|
| Breakup by System Type |
|
| Breakup by Communication Protocol |
|
| Breakup by Application |
|
| Breakup by Region |
|
| Market Dynamics |
|
| Competitive Landscape |
|
| Companies Covered |
|
Datasheet
One User
USD 2,499
USD 2,249
tax inclusive*
Single User License
One User
USD 3,999
USD 3,599
tax inclusive*
Five User License
Five User
USD 4,999
USD 4,249
tax inclusive*
Corporate License
Unlimited Users
USD 5,999
USD 5,099
tax inclusive*
*Please note that the prices mentioned below are starting prices for each bundle type. Kindly contact our team for further details.*
Flash Bundle
Small Business Bundle
Growth Bundle
Enterprise Bundle
*Please note that the prices mentioned below are starting prices for each bundle type. Kindly contact our team for further details.*
Flash Bundle
Number of Reports: 3
20%
tax inclusive*
Small Business Bundle
Number of Reports: 5
25%
tax inclusive*
Growth Bundle
Number of Reports: 8
30%
tax inclusive*
Enterprise Bundle
Number of Reports: 10
35%
tax inclusive*
How To Order
Our step-by-step guide will help you select, purchase, and access your reports swiftly, ensuring you get the information that drives your decisions, right when you need it.

Select License Type
Choose the right license for your needs and access rights.

Click on ‘Buy Now’
Add the report to your cart with one click and proceed to register.

Select Mode of Payment
Choose a payment option for a secure checkout. You will be redirected accordingly.
Gain insights to stay ahead and seize opportunities.

Get insights & trends for a competitive edge.
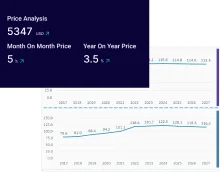
Track prices with detailed trend reports.
Analyse trade data for supply chain insights.

Leverage cost reports for smart savings

Enhance supply chain with partnerships.

Connect For More Information
Our expert team of analysts will offer full support and resolve any queries regarding the report, before and after the purchase.
Our expert team of analysts will offer full support and resolve any queries regarding the report, before and after the purchase.
We employ meticulous research methods, blending advanced analytics and expert insights to deliver accurate, actionable industry intelligence, staying ahead of competitors.
Our skilled analysts offer unparalleled competitive advantage with detailed insights on current and emerging markets, ensuring your strategic edge.
We offer an in-depth yet simplified presentation of industry insights and analysis to meet your specific requirements effectively.


